WindCFD Validation
A project-based validation summary comparing BIMWERX WindCFD results against delivered wind tunnel testing for a Hong Kong overpass road model, with mapped pressure zones, pair boards, flow visuals, and overall comparability notes.
WindCFD vs HKU Wind Tunnel Summary
This report brings the first-pass WindCFD / wind tunnel comparison into one place. The mapped tunnel locations are best-guess registrations from the delivered workbook and PDF point layouts back onto the three CFD submodels. The comparison is useful for identifying broad agreement and broad mismatch patterns, but it should still be treated as an engineering draft rather than a final calibrated validation.
What This HTML Is Showing
The CFD screenshot values you called out are treated as global ranges for each simplified submodel, while the tables and pair boards focus on representative mapped overpass faces. Those two things are related, but not identical: the global max/min can occur off the exact tunnel sampling line, so the report separates the global CFD range from the mapped overpass comparison on purpose.
The new Overall Comparability Lens in each section is intended to answer the practical question of whether the CFD and tunnel are broadly telling the same story in the highlighted red and blue zones. It does that by choosing the least brittle real comparison from the mapped data itself, rather than forcing an exact peak-to-peak match.
Global CFD Range vs Representative Pair
| Submodel | Representative pair | Global CFD max (Pa) | Global CFD min (Pa) | Mean snap distance (mm) | Max snap distance (mm) | Mapping status |
|---|---|---|---|---|---|---|
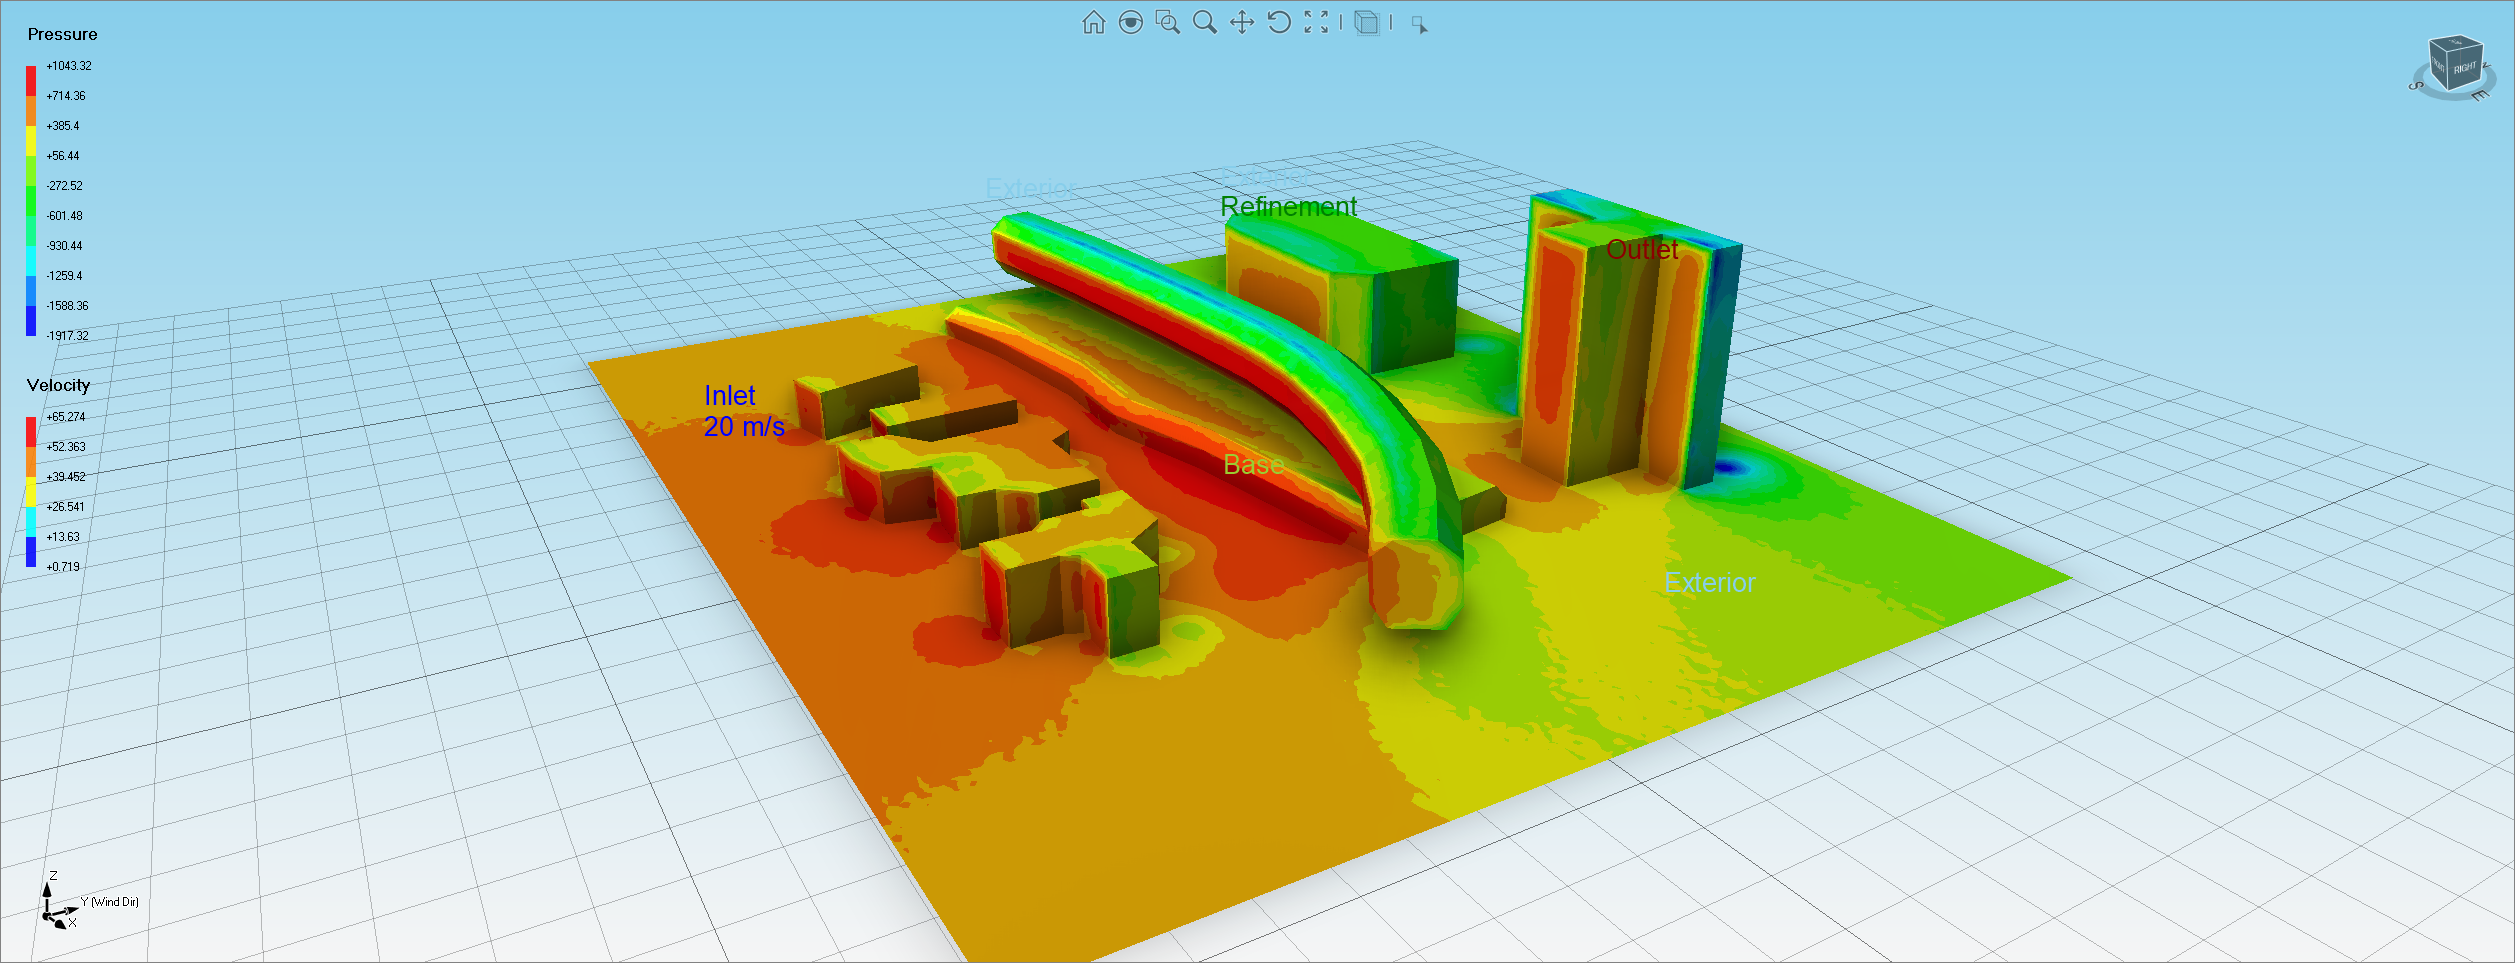
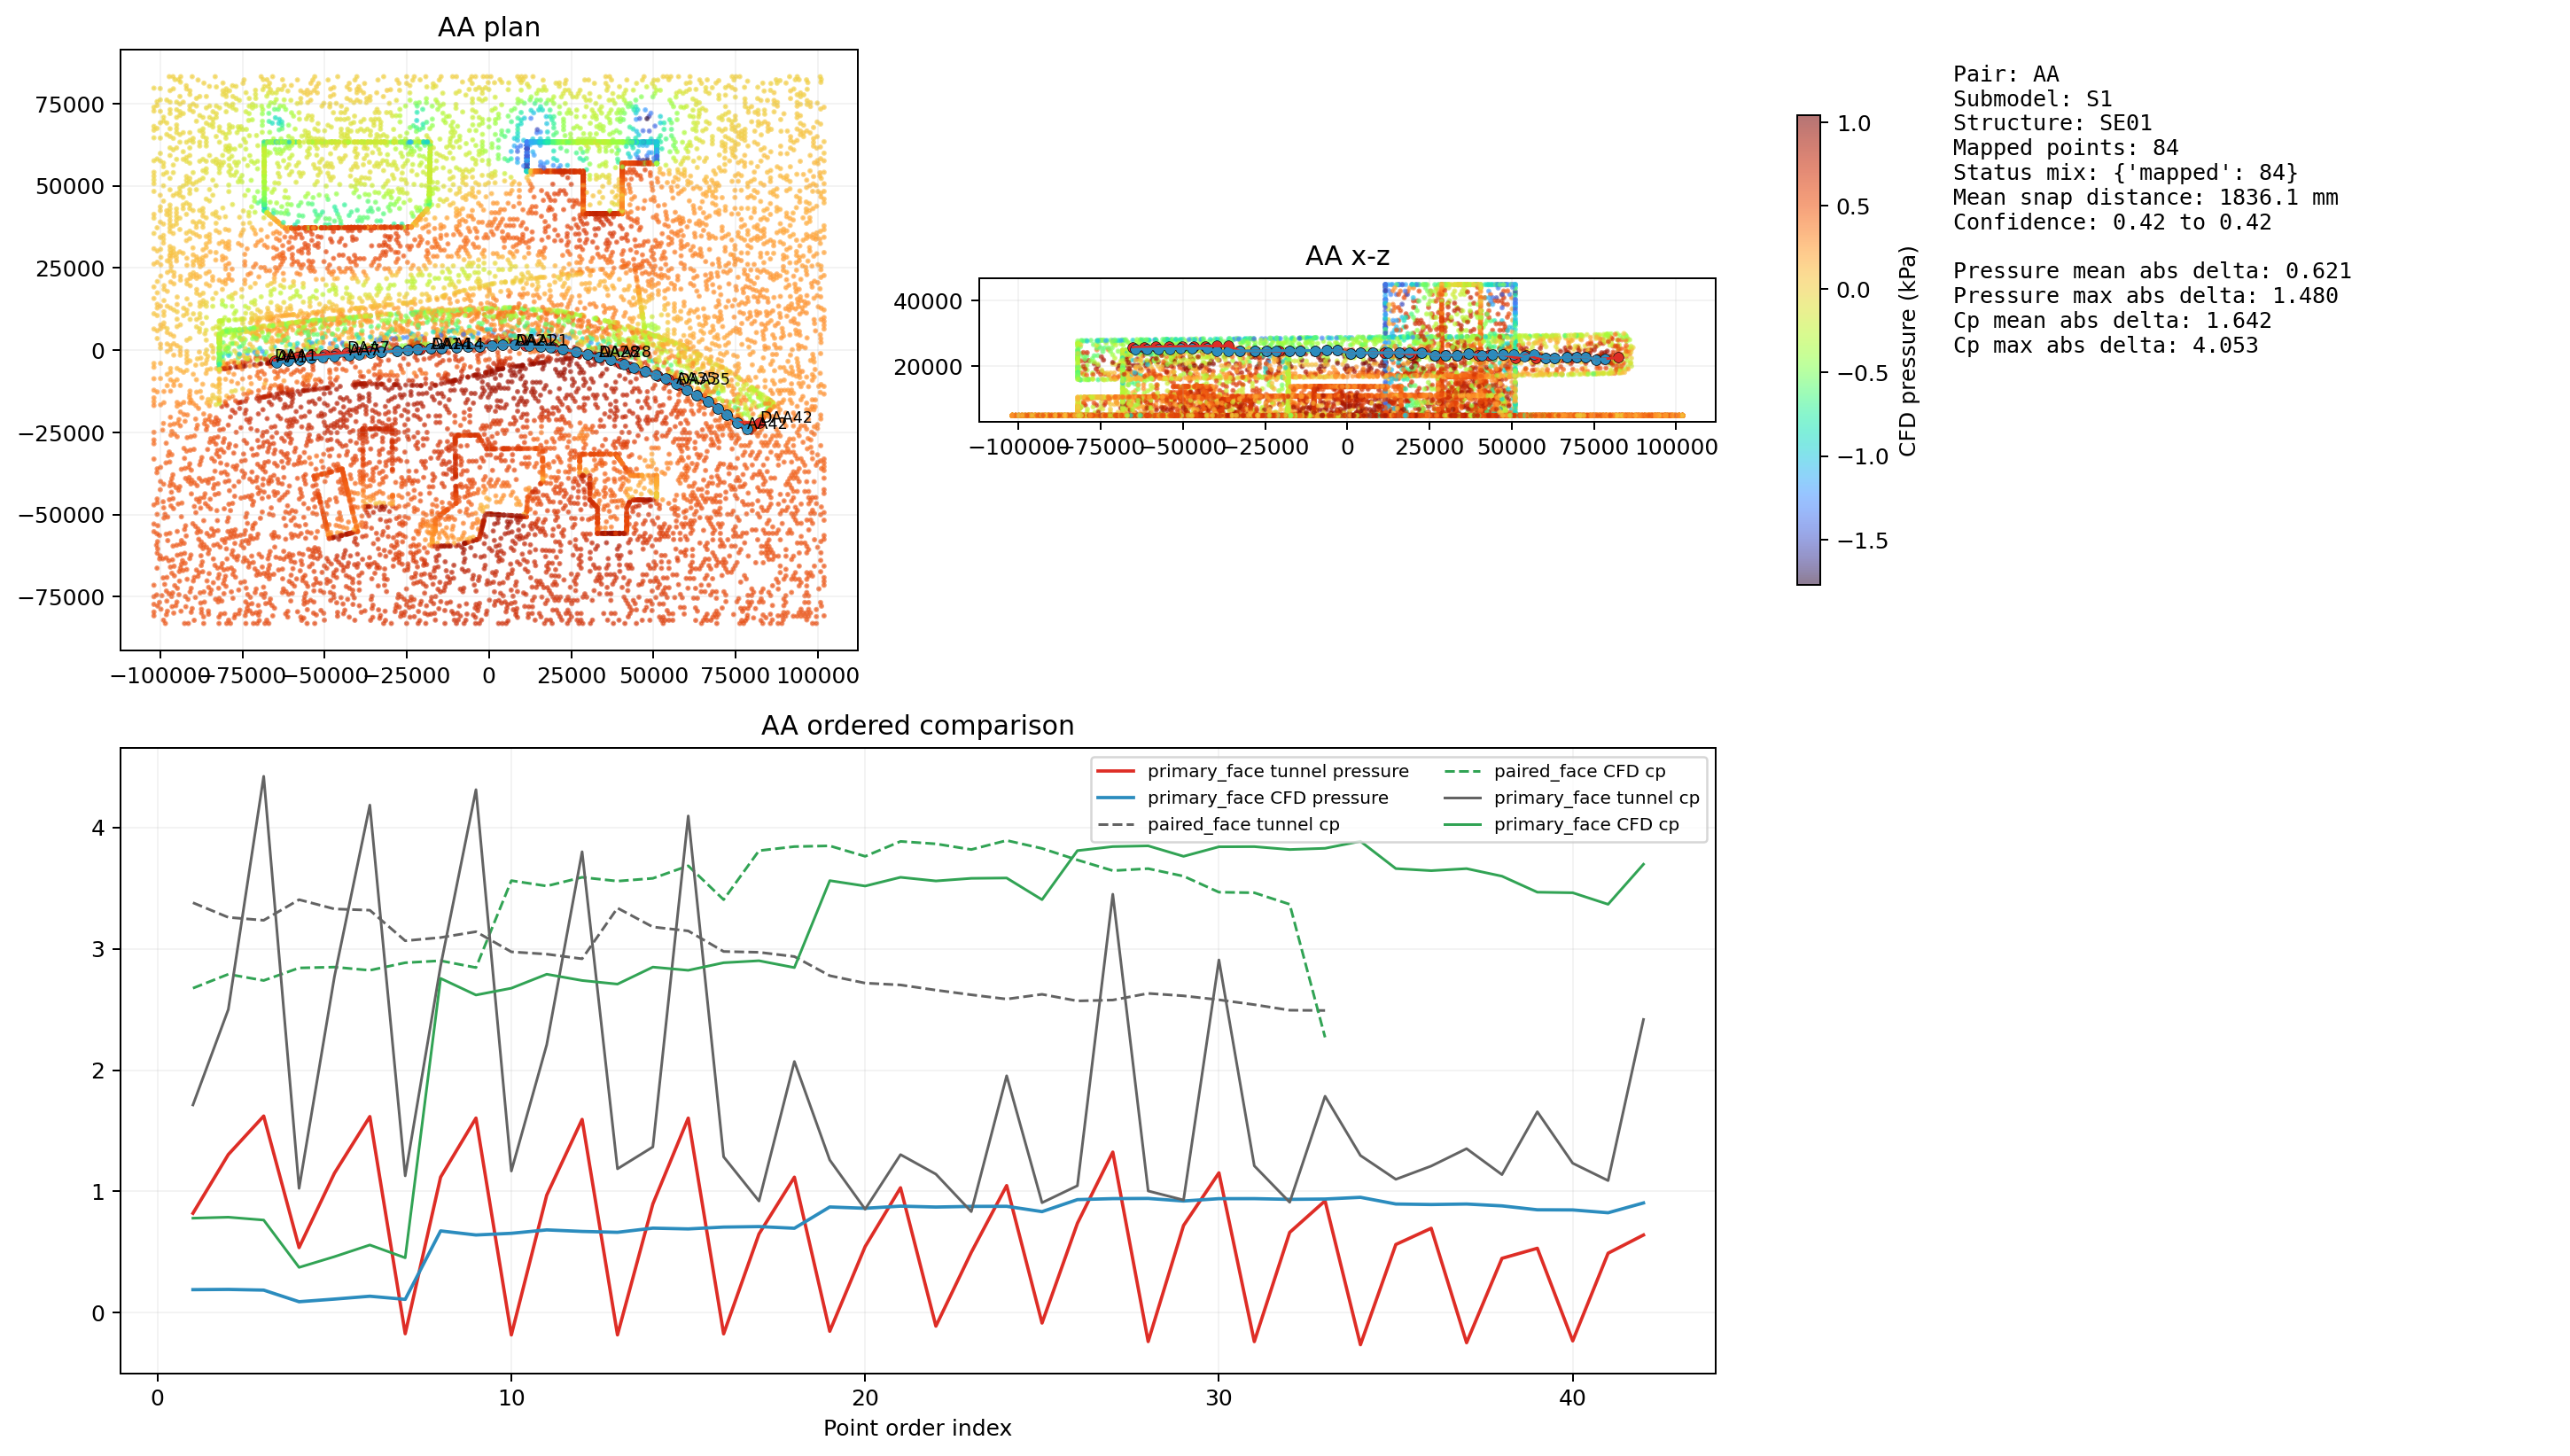
| S1 | AA | 1043.320 | -1917.32 | 1836.1 | 3992.1 | mapped: 84 |
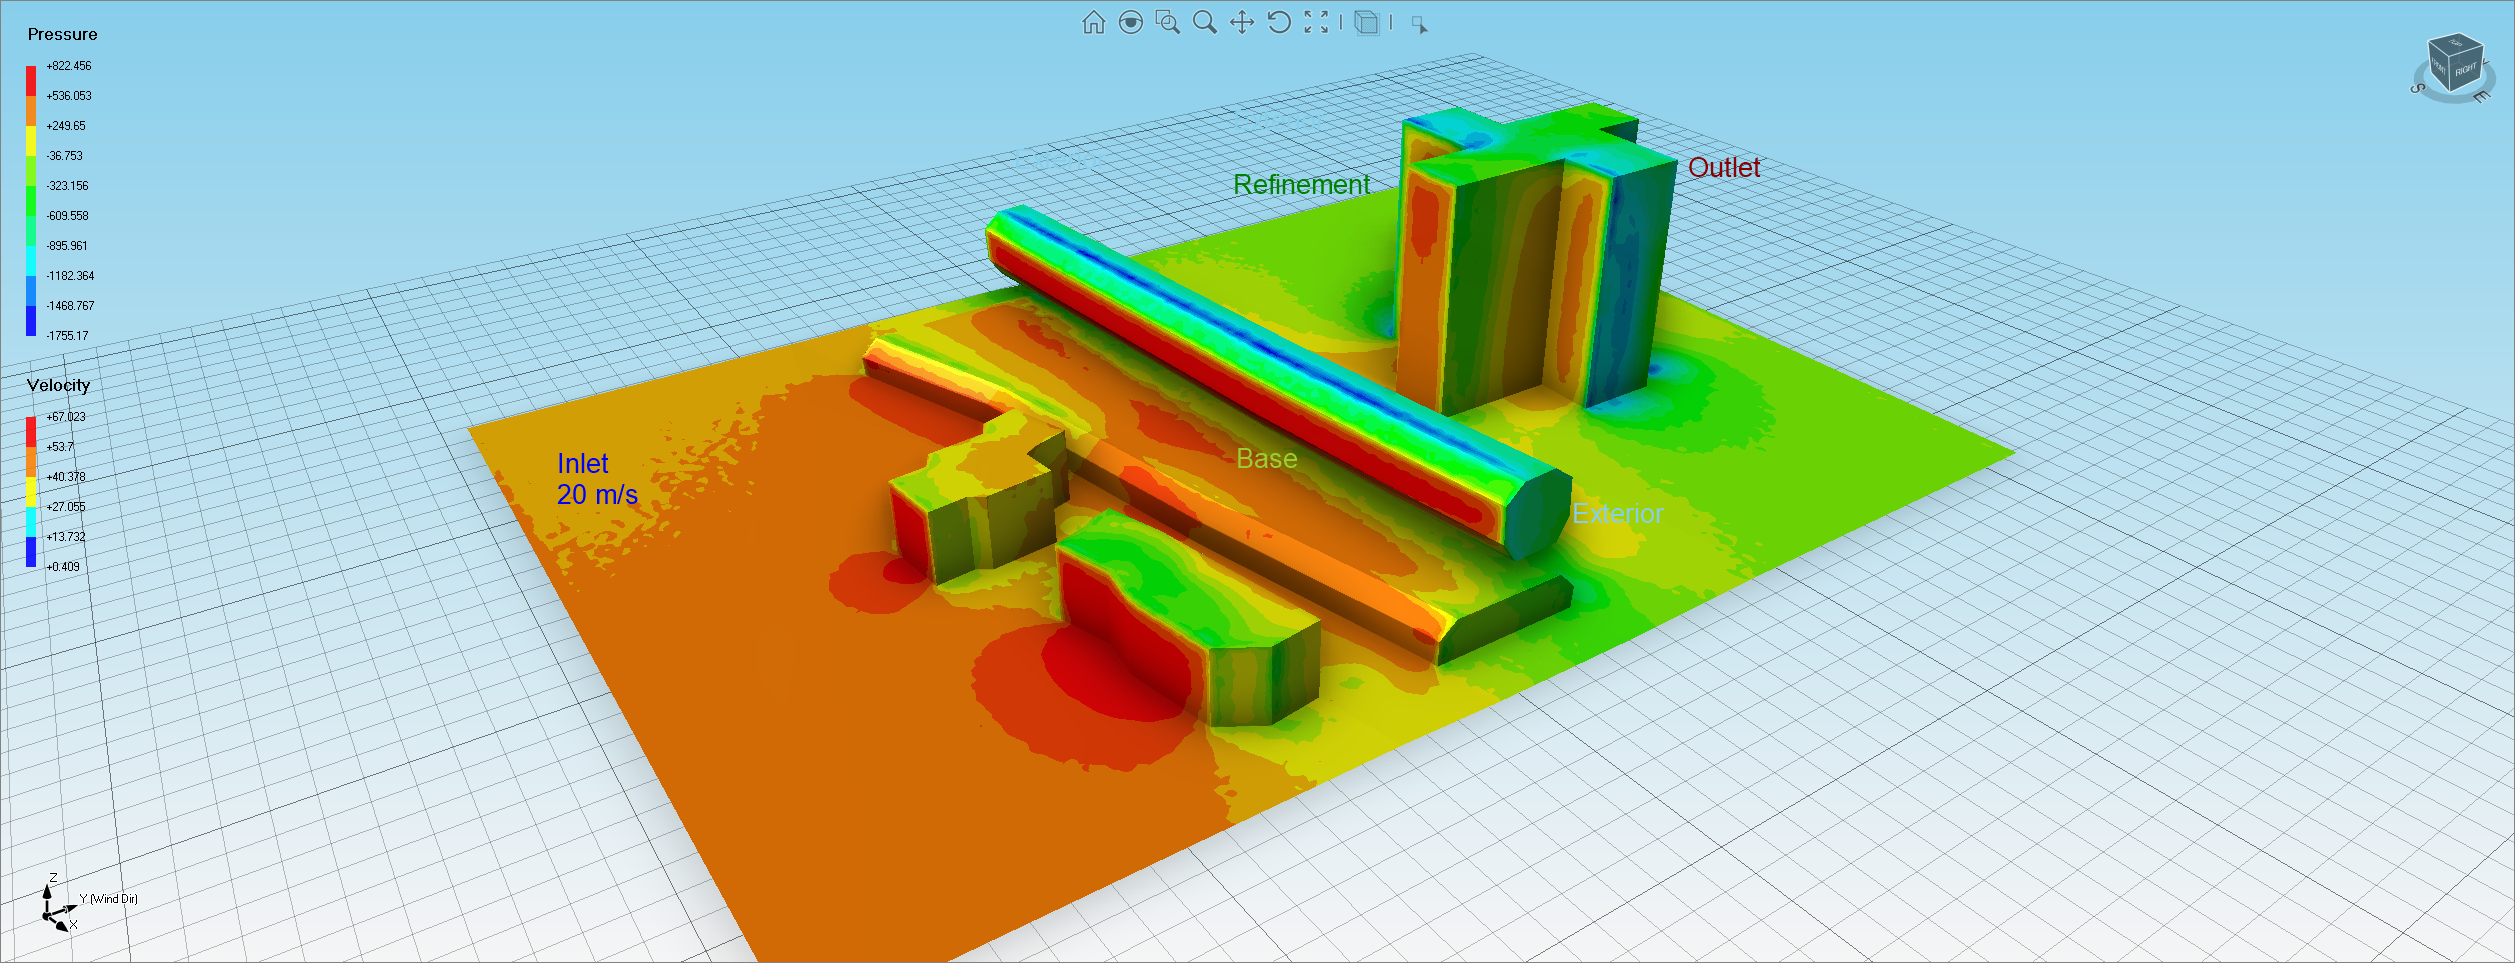
| S2 | BA | 822.456 | -1755.17 | 1552.3 | 2629.5 | mapped: 110 |
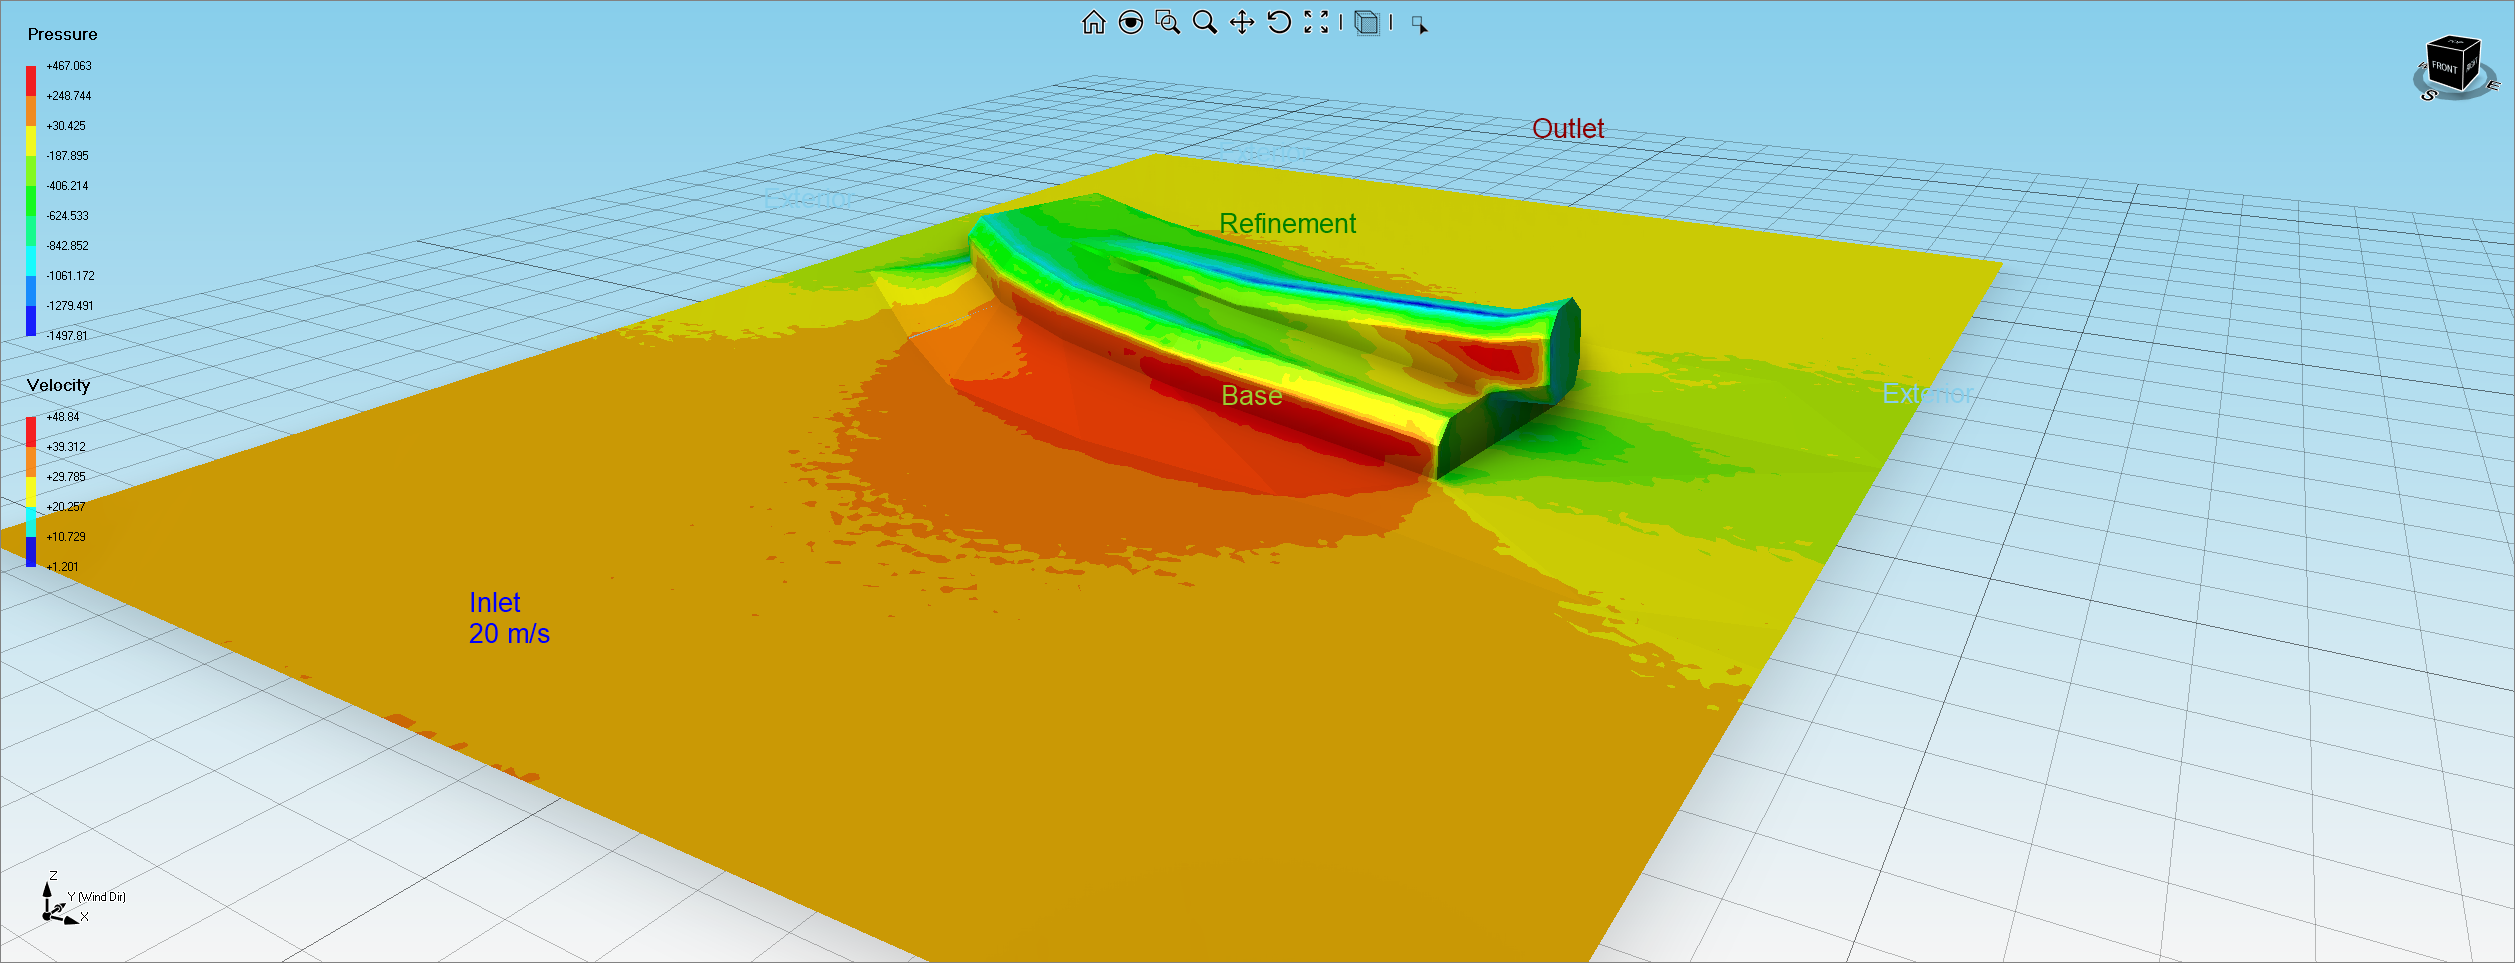
| S3 | CA | 467.063 | -1497.81 | 2750.0 | 9675.9 | mapped: 99, mapped_with_warning: 5 |
Representative Delta Snapshot
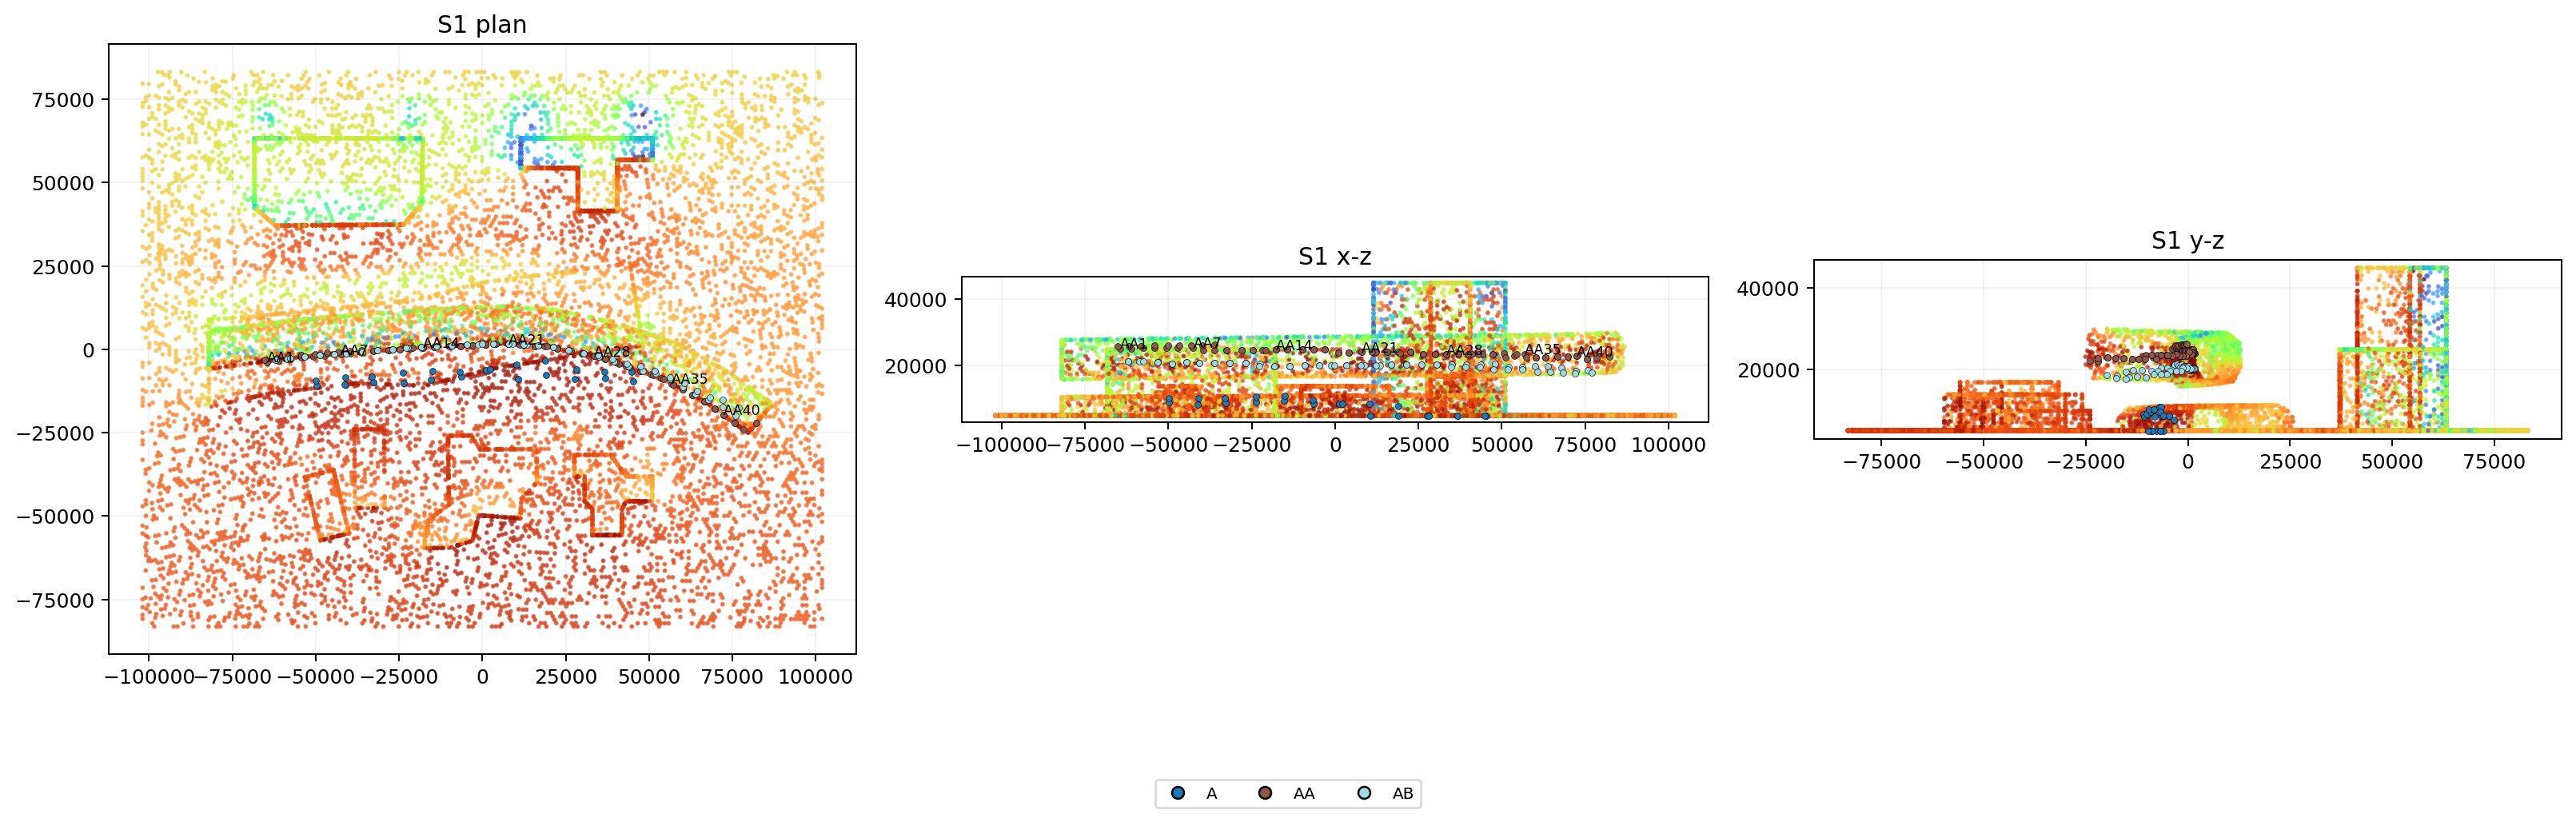
This table isolates the main representative pairs used in the HTML sections below: AA for S1, BA for S2, and CA for S3.
| pair_key | metric | count | mean | max |
|---|---|---|---|---|
| AA | cpextreme_max | 75 | 1.404 | 3.655 |
| AA | cpextreme_min | 9 | 3.623 | 4.053 |
| AA | net_peak_max_kpa | 42 | 0.621 | 1.480 |
| BA | cpextreme_max | 64 | 1.315 | 3.207 |
| BA | cpextreme_min | 46 | 2.807 | 5.899 |
| BA | net_peak_max_kpa | 37 | 0.465 | 1.452 |
| BA | net_peak_min_kpa | 18 | 1.099 | 1.771 |
| CA | cpextreme_min | 104 | 2.215 | 5.622 |
| CA | net_peak_min_kpa | 52 | 1.234 | 2.468 |
S1 Best-Guess Comparison
Best-guess hotspot interpretation: the red pressure band is treated as the windward/crest response on the upper curved overpass surface, while the blue zone is treated as the opposing suction band wrapping around the upper outer face.
Primary Face Comparison Metrics
| metric | points | tunnel_mean | cfd_mean | abs_delta_mean | abs_delta_max |
|---|---|---|---|---|---|
| cpextreme_max | 42 | 1.833312 | 2.918263 | 1.927039 | 3.655486 |
| net_peak_max_kpa | 42 | 0.627564 | 0.714974 | 0.620907 | 1.479859 |
Mapped Pair CFD Pressure / Cp Range
| cfd_pressure_kpa | cfd_cp | |||||
|---|---|---|---|---|---|---|
| min | max | mean | min | max | mean | |
| face_label | ||||||
| paired_face | -0.555 | 0.953 | 0.559 | -2.264 | 3.892 | 2.280 |
| primary_face | 0.092 | 0.952 | 0.715 | 0.374 | 3.885 | 2.918 |
Zone-Average Hotspot Check
These rows average a short neighborhood around the mapped CFD pressure peak and CFD suction trough within the wider mapped submodel, so the result is less sensitive than a single-point peak callout.
| Zone | Mapped family | Hotspot point | Order range | Points | CFD avg (kPa) | Tunnel avg (kPa) | Tunnel source | Best-guess difference |
|---|---|---|---|---|---|---|---|---|
| Red zone | AB (primary_face) | AB18 | 14-22 | 9 | 1.015 | 0.945 | net_peak_max_kpa | CFD pressure 7.5% higher |
| Blue zone | DAA (paired_face) | DAA4 | 1-9 | 9 | -0.441 | -1.328 | cpextreme_min * q | CFD suction magnitude 66.8% lower |
Overall Comparability Lens
These rows choose the least brittle real comparison for each highlighted zone from the same mapped data: broader face average, local hotspot band, or track-envelope average. The wording here is intentionally pattern-led, while the exact percentage deltas remain in the detailed hotspot table above.
| Zone | Comparison lens | Points | Track sign agreement | Executive read | Pattern note |
|---|---|---|---|---|---|
| Red zone | Broader face average | 87 | 82% same sign | close overall | close overall (3.1% higher) |
| Blue zone | Track envelope average | 3 | 100% same sign | pattern-aligned | same suction band captured; CFD remains softer in amplitude on current registration |
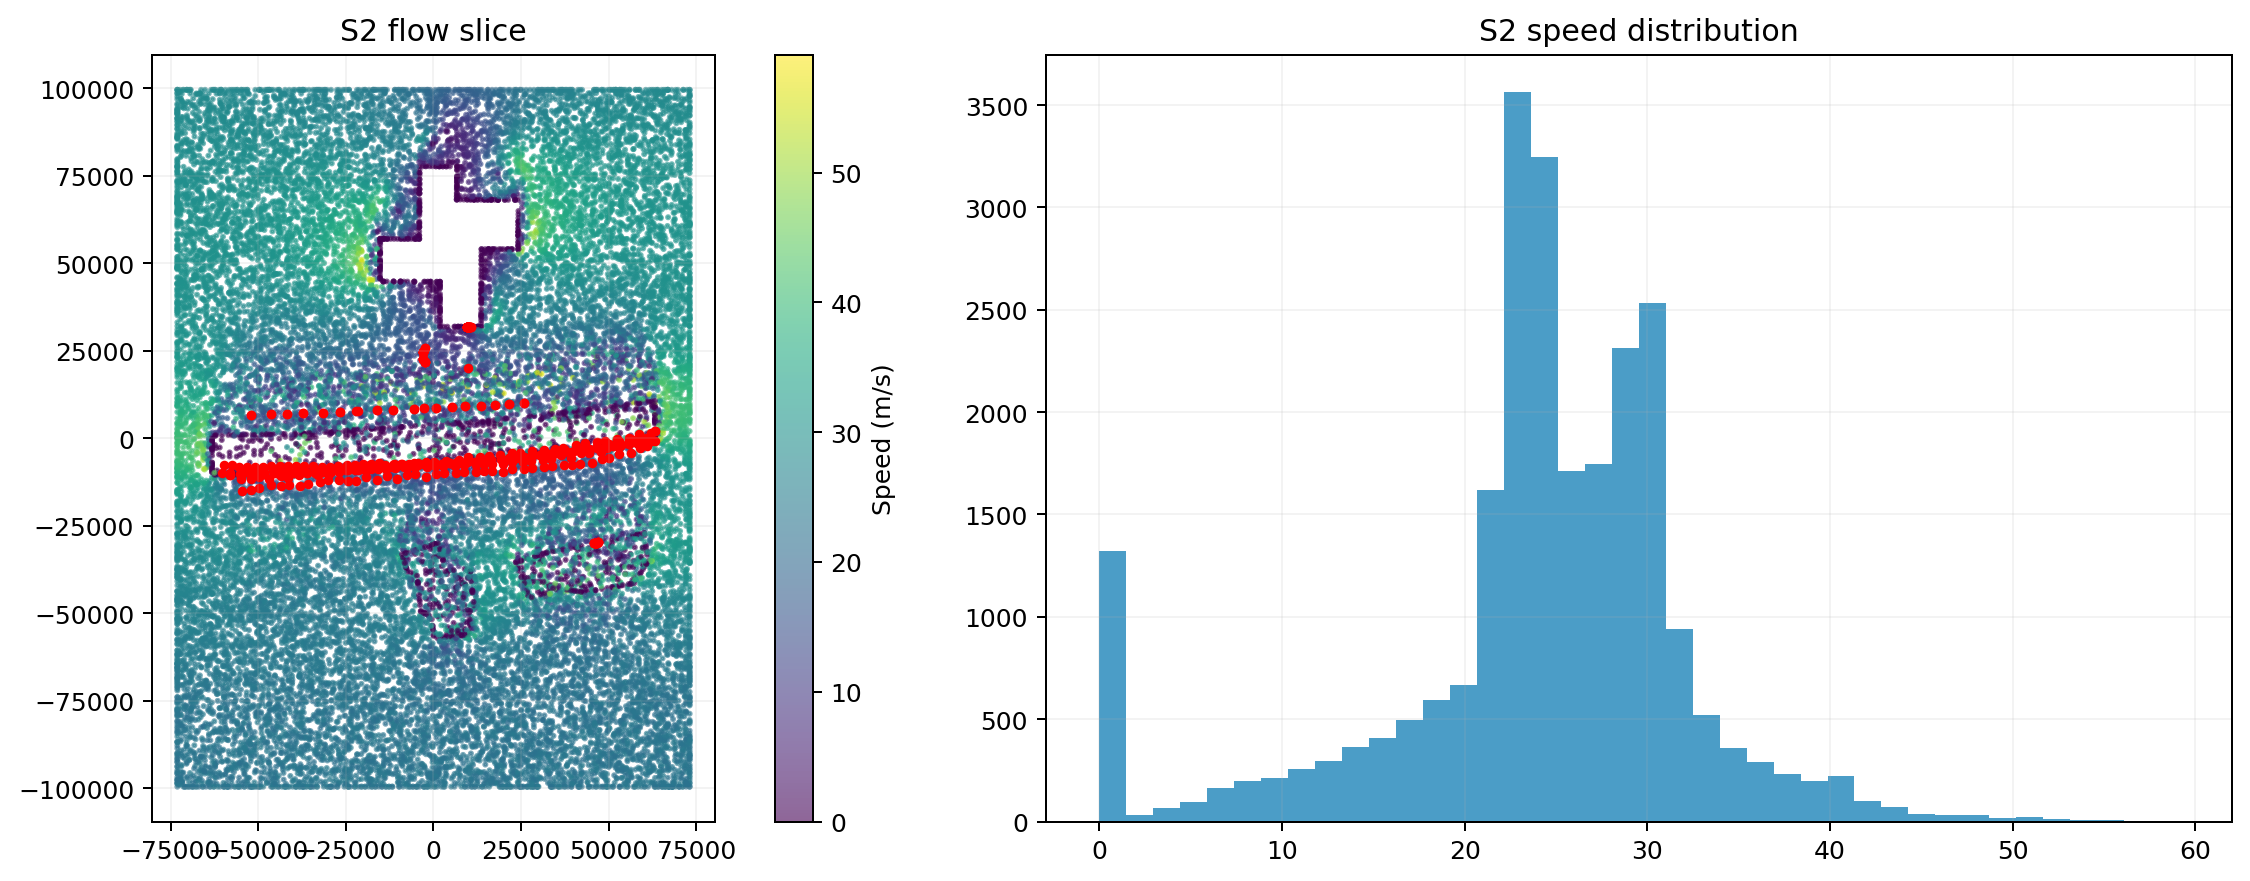
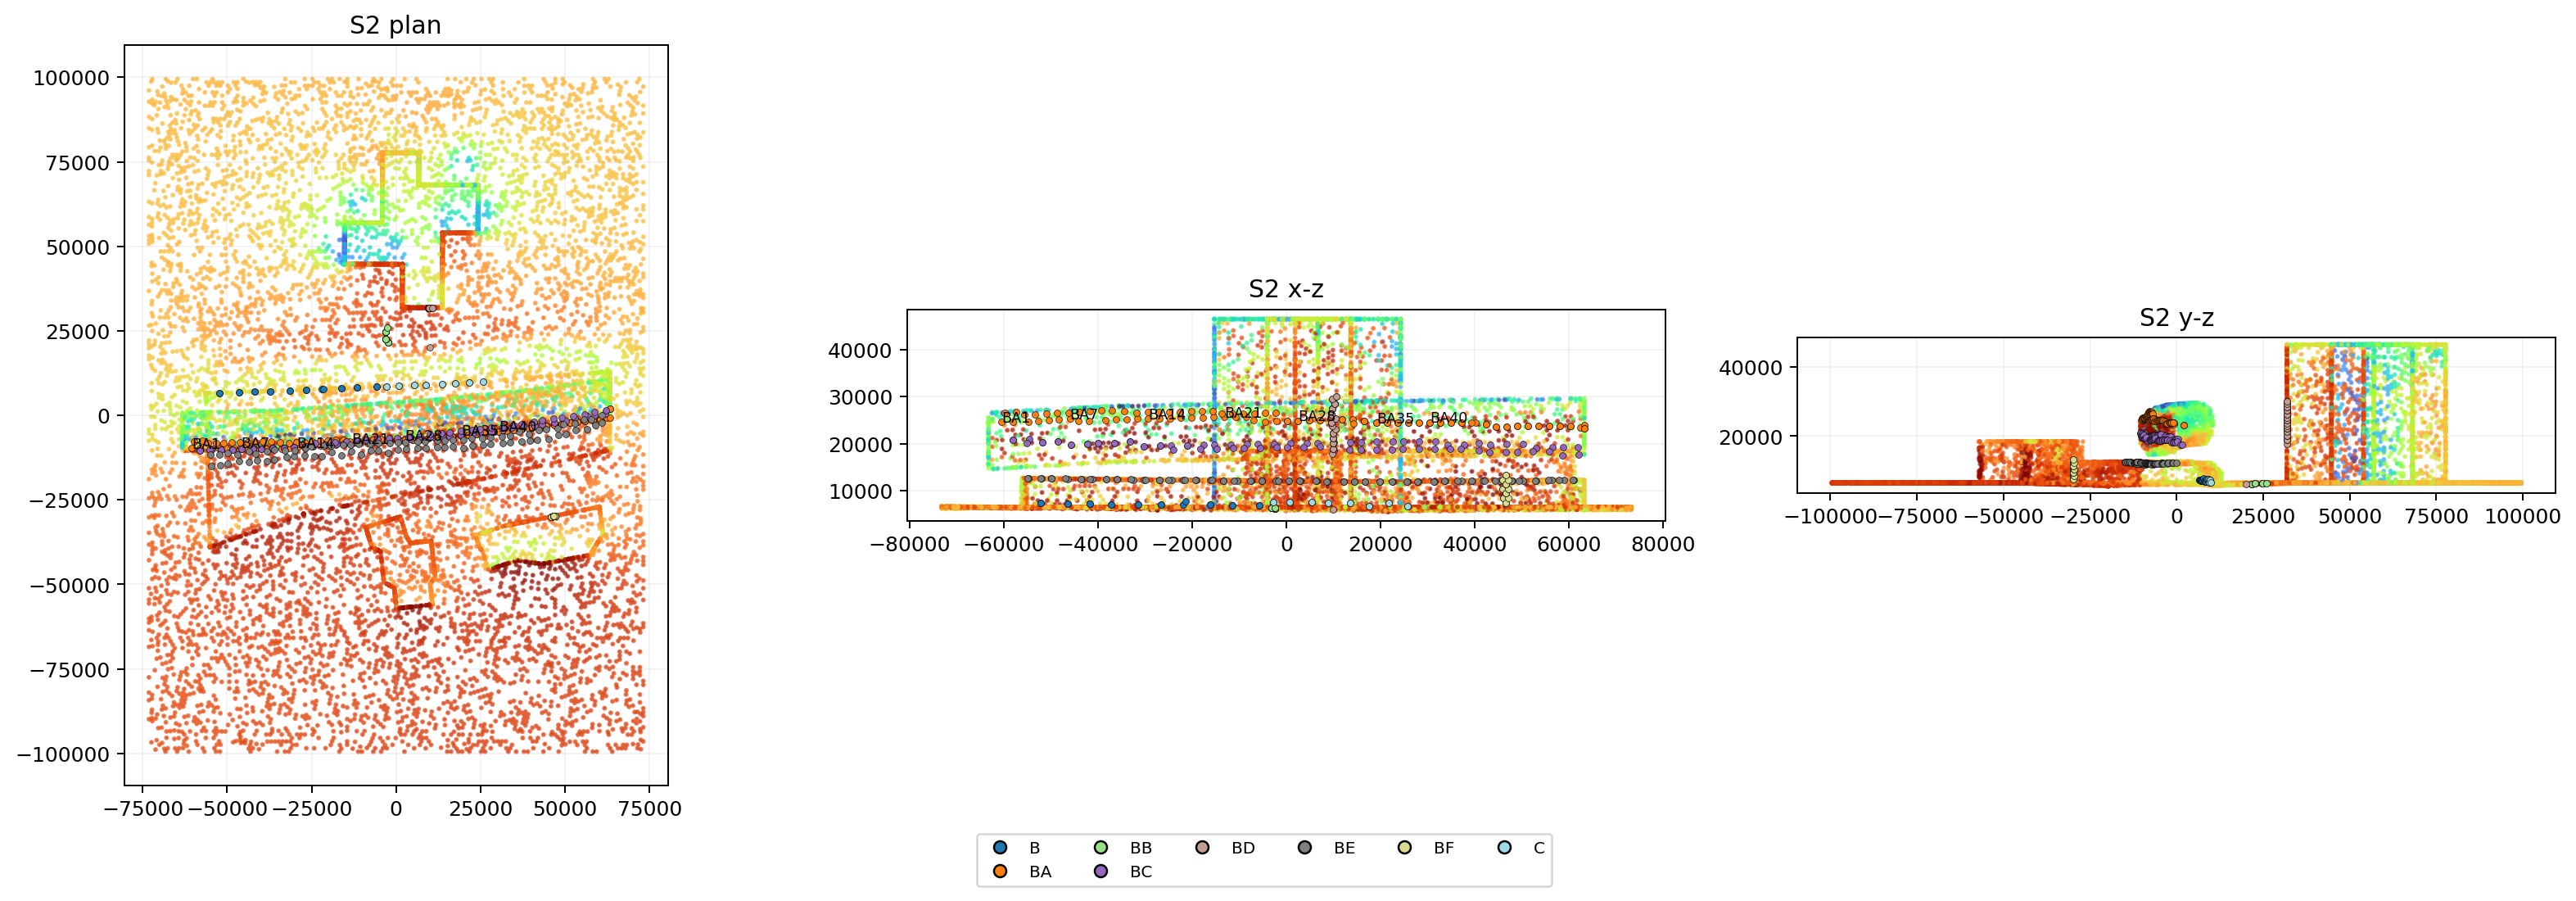
S2 Best-Guess Comparison
Best-guess hotspot interpretation: the main positive pressure zone is treated as the exposed upper straight span on the overpass/barrier assembly, with suction concentrated along the opposite edge and near the upper transition around the tower region.
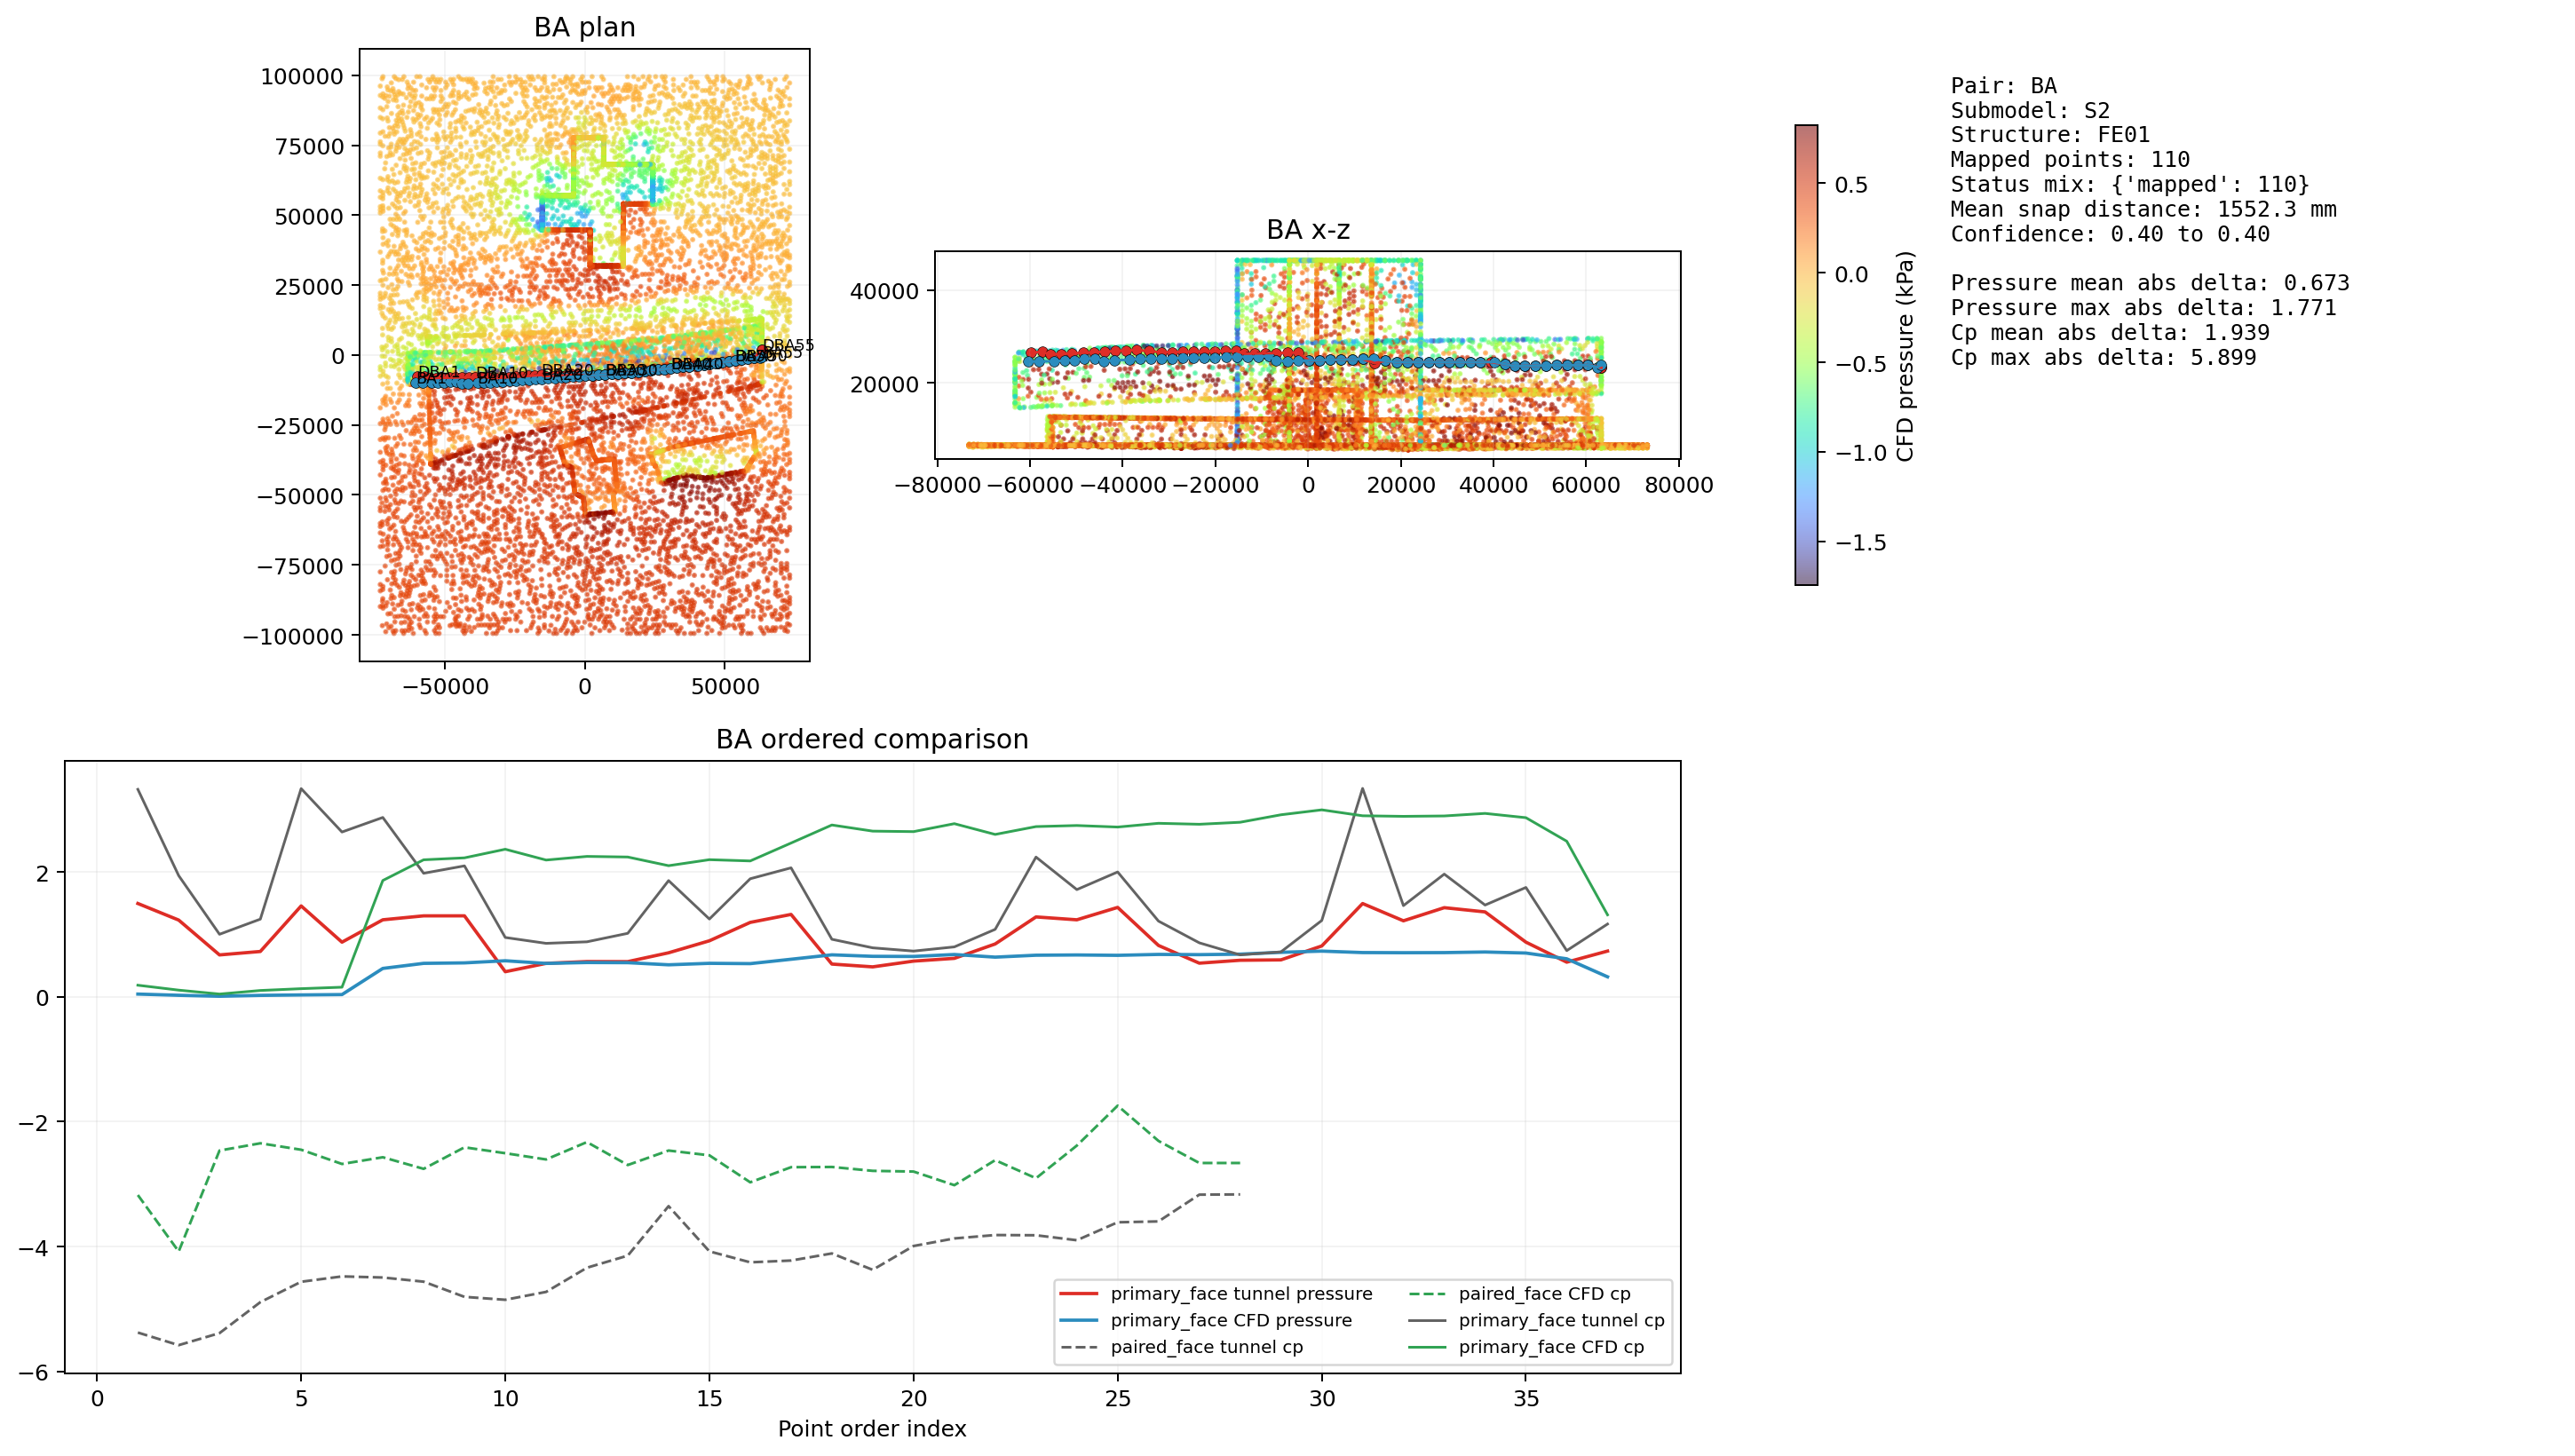
Primary Face Comparison Metrics
| metric | points | tunnel_mean | cfd_mean | abs_delta_mean | abs_delta_max |
|---|---|---|---|---|---|
| cpextreme_max | 37 | 1.572584 | 2.142955 | 1.338966 | 3.206671 |
| cpextreme_min | 18 | -5.493253 | -0.829511 | 4.663742 | 5.898660 |
| net_peak_max_kpa | 37 | 0.934298 | 0.525024 | 0.465381 | 1.451990 |
| net_peak_min_kpa | 18 | -1.301875 | -0.203230 | 1.098644 | 1.770677 |
Mapped Pair CFD Pressure / Cp Range
| cfd_pressure_kpa | cfd_cp | |||||
|---|---|---|---|---|---|---|
| min | max | mean | min | max | mean | |
| face_label | ||||||
| paired_face | -0.999 | 0.735 | -0.013 | -4.080 | 2.999 | -0.054 |
| primary_face | -0.563 | 0.735 | 0.287 | -2.299 | 2.999 | 1.170 |
Zone-Average Hotspot Check
These rows average a short neighborhood around the mapped CFD pressure peak and CFD suction trough within the wider mapped submodel, so the result is less sensitive than a single-point peak callout.
| Zone | Mapped family | Hotspot point | Order range | Points | CFD avg (kPa) | Tunnel avg (kPa) | Tunnel source | Best-guess difference |
|---|---|---|---|---|---|---|---|---|
| Red zone | BC (primary_face) | BC11 | 6-16 | 11 | 0.796 | 0.570 | net_peak_max_kpa | CFD pressure 39.6% higher |
| Blue zone | DBA (paired_face) | DBA2 | 1-9 | 9 | -0.678 | -1.202 | cpextreme_min * q | CFD suction magnitude 43.6% lower |
Overall Comparability Lens
These rows choose the least brittle real comparison for each highlighted zone from the same mapped data: broader face average, local hotspot band, or track-envelope average. The wording here is intentionally pattern-led, while the exact percentage deltas remain in the detailed hotspot table above.
| Zone | Comparison lens | Points | Track sign agreement | Executive read | Pattern note |
|---|---|---|---|---|---|
| Red zone | Track envelope average | 8 | 88% same sign | close overall | close overall (2.4% lower) |
| Blue zone | Track envelope average | 6 | 100% same sign | pattern-aligned | same suction band captured; CFD remains softer in amplitude on current registration |
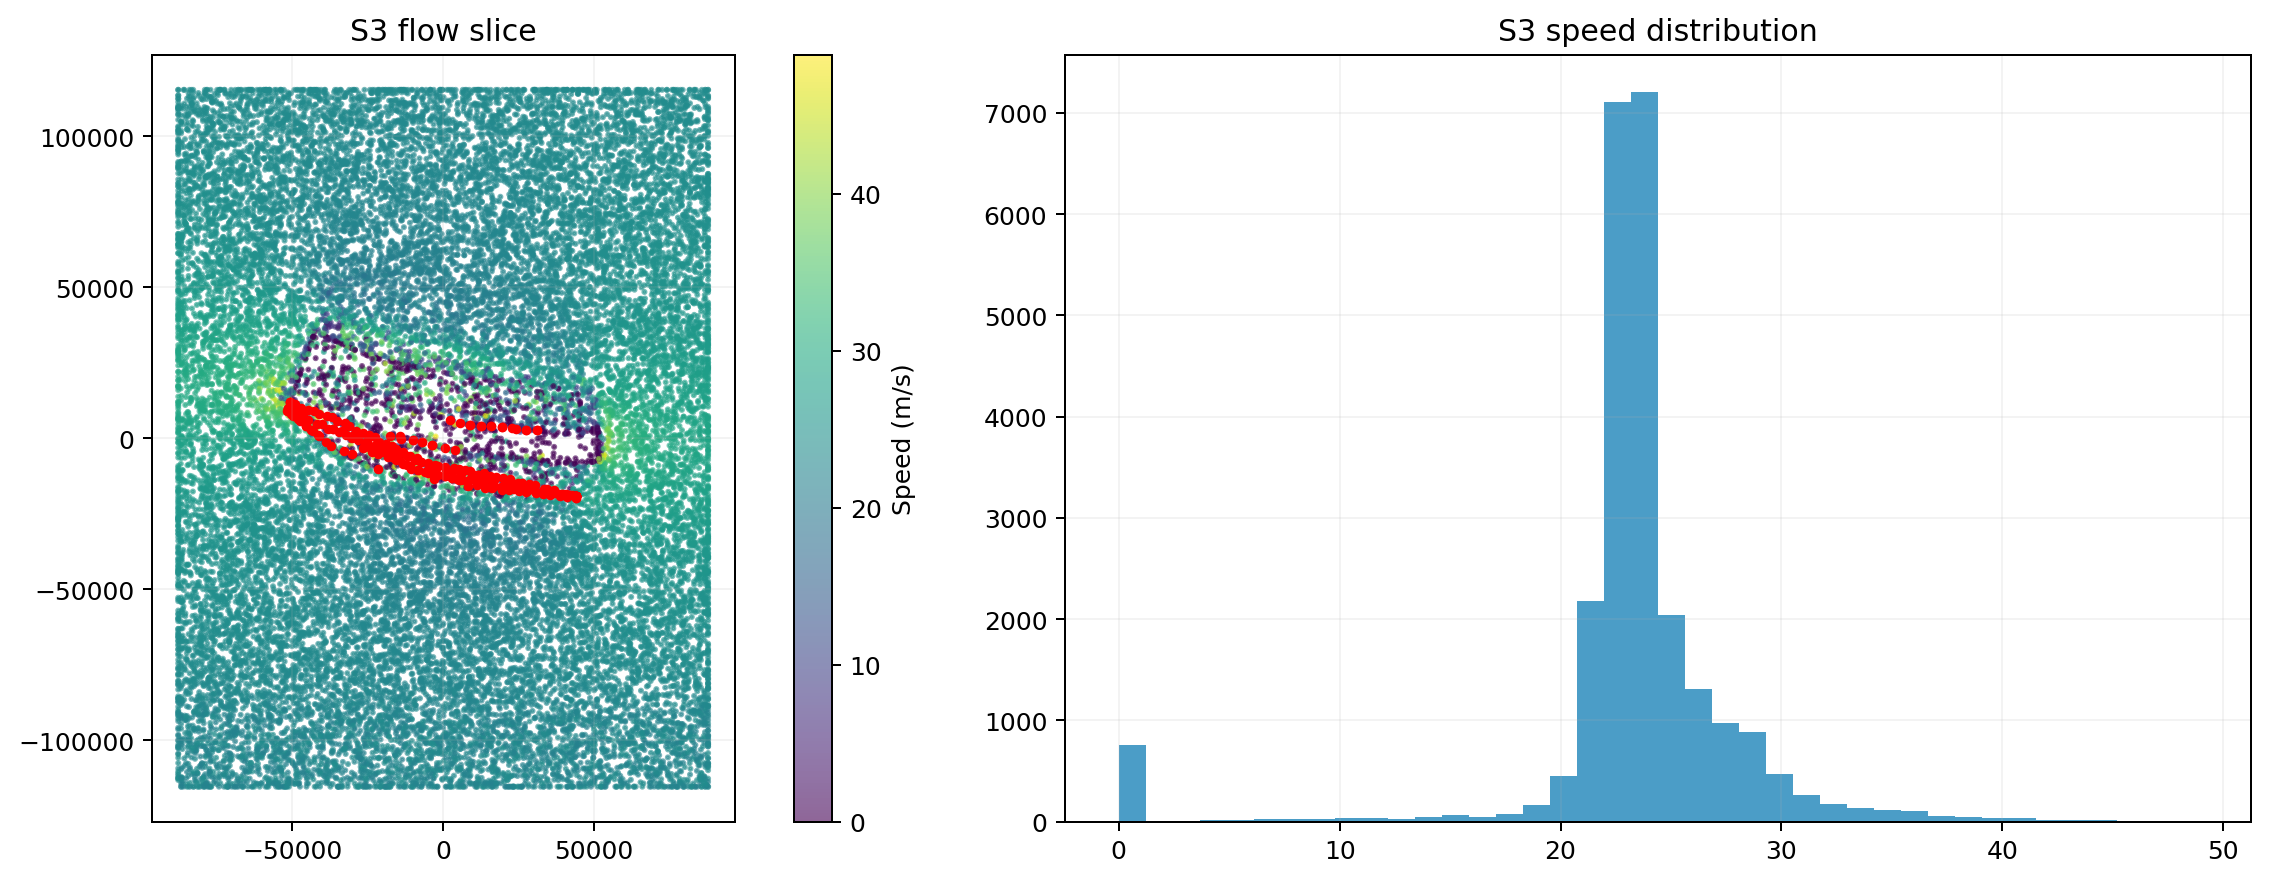
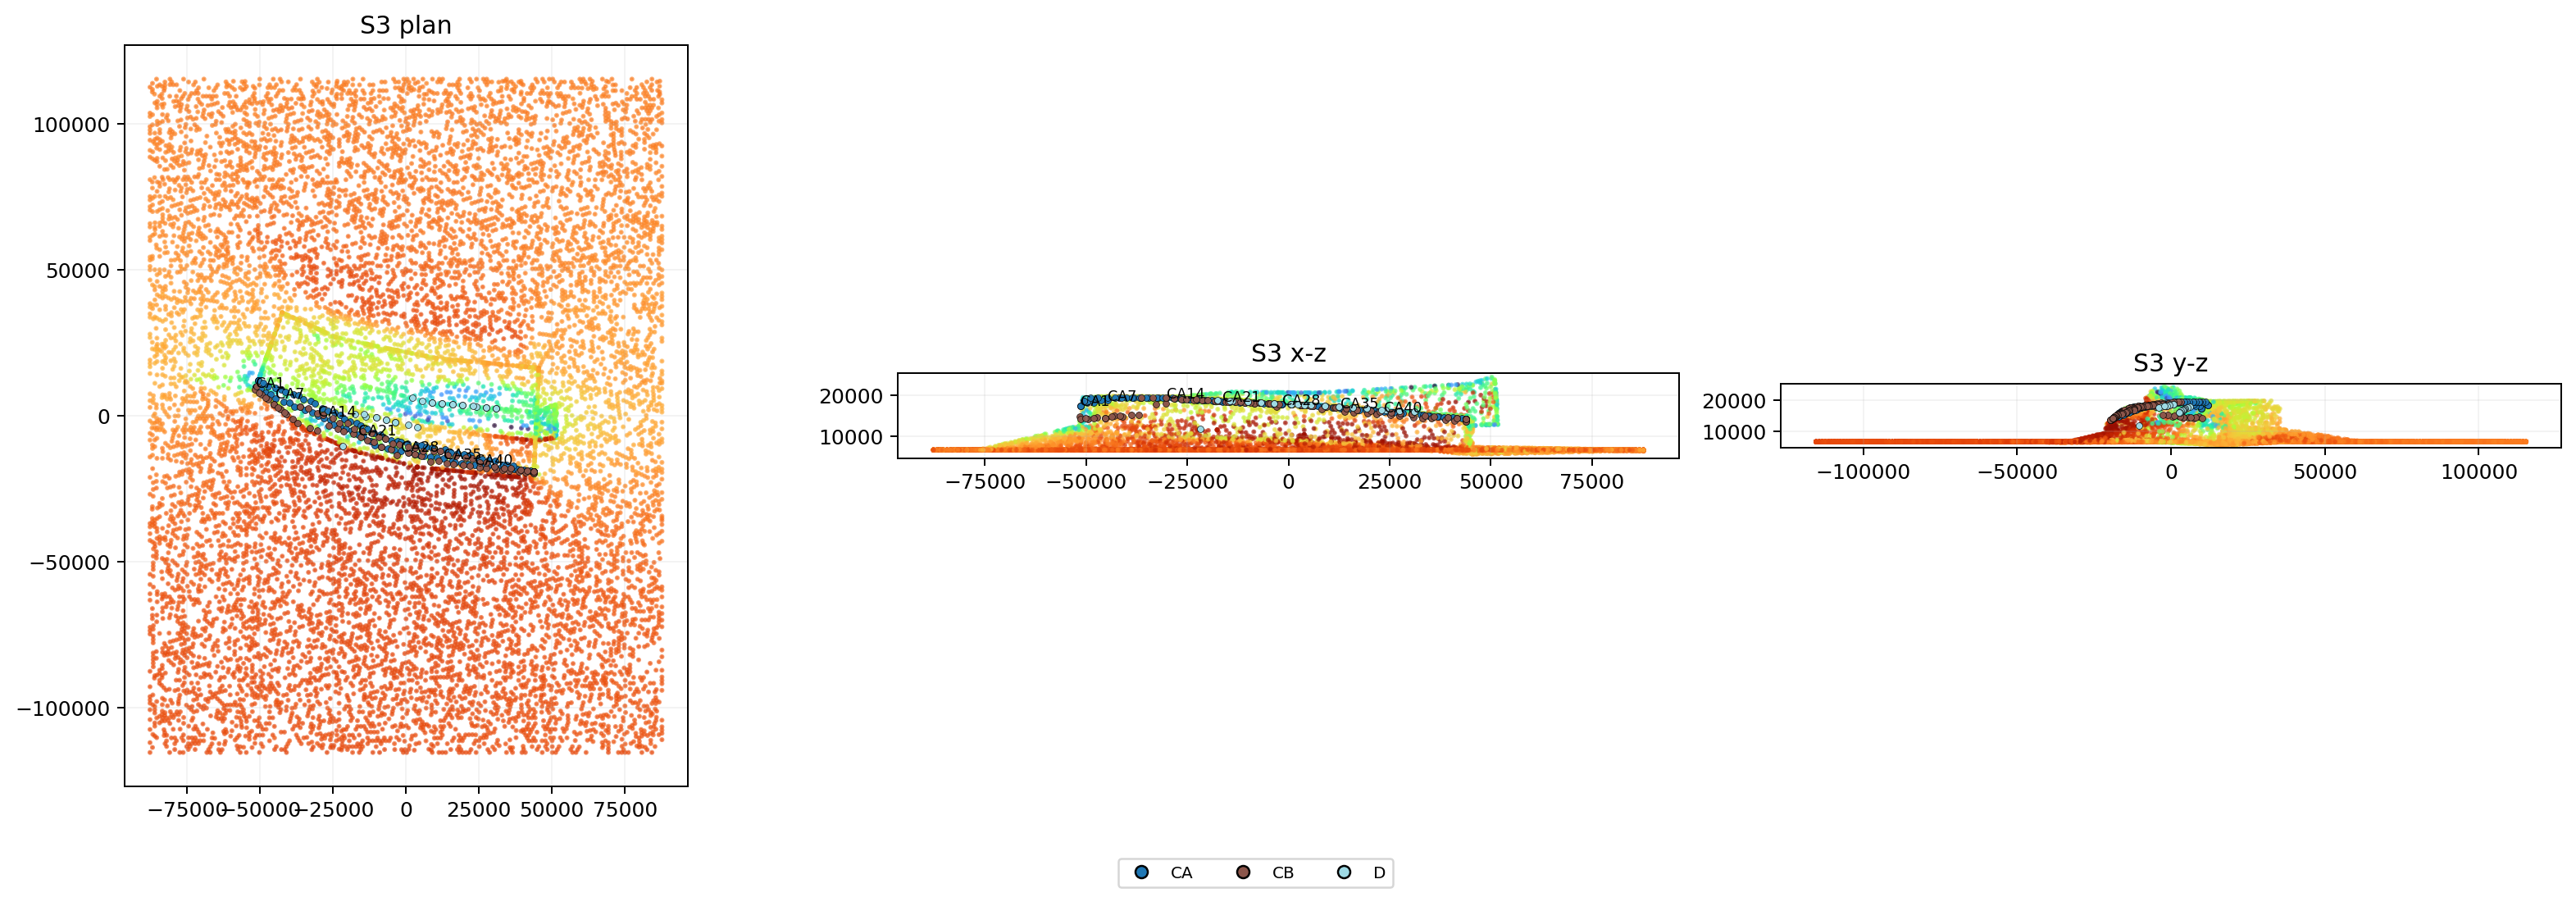
S3 Best-Guess Comparison
Best-guess hotspot interpretation: this segment is suction-dominated on the mapped overpass face, with the strongest positive patch appearing nearer the downstream end of the curved segment and the broader negative band tracking along the upper crown.
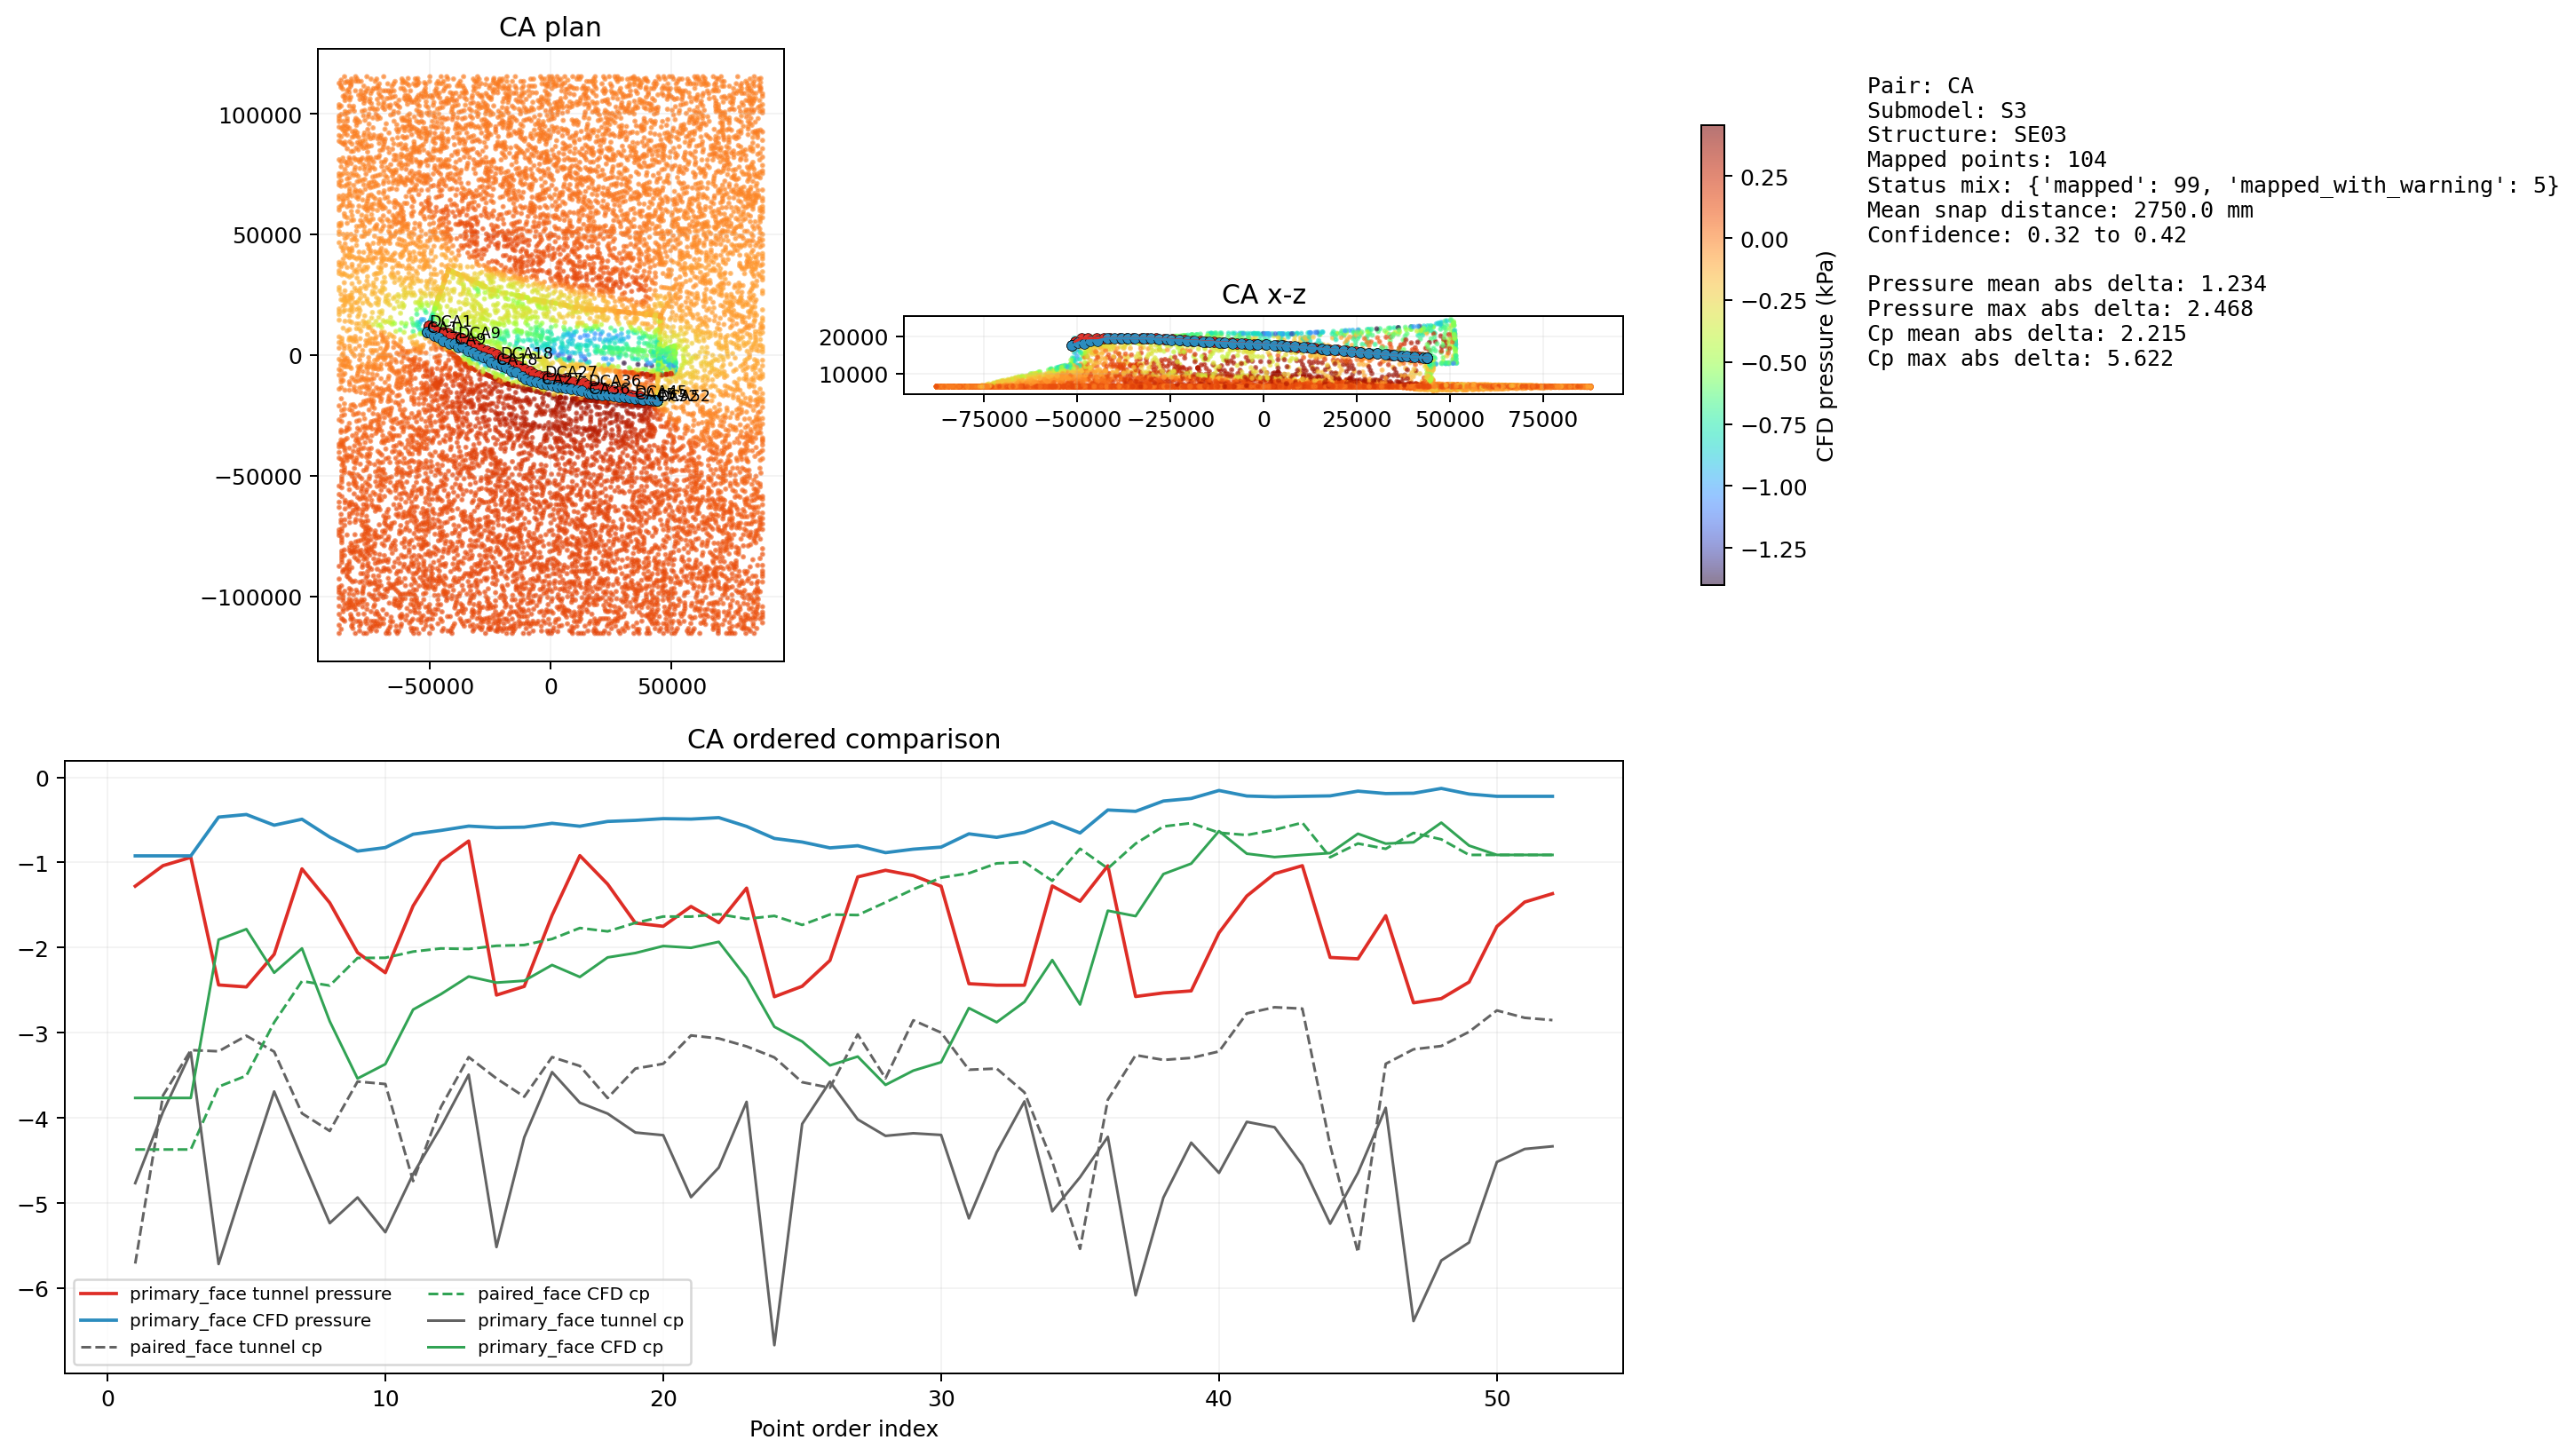
Primary Face Comparison Metrics
| metric | points | tunnel_mean | cfd_mean | abs_delta_mean | abs_delta_max |
|---|---|---|---|---|---|
| cpextreme_min | 52 | -4.547488 | -2.125139 | 2.442883 | 5.622491 |
| net_peak_min_kpa | 52 | -1.754859 | -0.520659 | 1.234200 | 2.468223 |
Mapped Pair CFD Pressure / Cp Range
| cfd_pressure_kpa | cfd_cp | |||||
|---|---|---|---|---|---|---|
| min | max | mean | min | max | mean | |
| face_label | ||||||
| paired_face | -1.071 | -0.131 | -0.399 | -4.371 | -0.533 | -1.629 |
| primary_face | -0.923 | -0.130 | -0.521 | -3.766 | -0.533 | -2.125 |
Zone-Average Hotspot Check
These rows average a short neighborhood around the mapped CFD pressure peak and CFD suction trough within the wider mapped submodel, so the result is less sensitive than a single-point peak callout.
| Zone | Mapped family | Hotspot point | Order range | Points | CFD avg (kPa) | Tunnel avg (kPa) | Tunnel source | Best-guess difference |
|---|---|---|---|---|---|---|---|---|
| Red zone | D (primary_face) | D1 | 1-3 | 3 | -0.139 | 1.628 | net_peak_max_kpa | CFD pressure 108.5% lower |
| Blue zone | DCA (paired_face) | DCA1 | 1-7 | 7 | -0.893 | -0.913 | cpextreme_min * q | CFD suction magnitude 2.1% lower |
Overall Comparability Lens
These rows choose the least brittle real comparison for each highlighted zone from the same mapped data: broader face average, local hotspot band, or track-envelope average. The wording here is intentionally pattern-led, while the exact percentage deltas remain in the detailed hotspot table above.
| Zone | Comparison lens | Points | Track sign agreement | Executive read | Pattern note |
|---|---|---|---|---|---|
| Red zone | Track envelope average | 3 | - | qualitative only | positive patch visible qualitatively; numeric match not robust on current registration |
| Blue zone | Local hotspot band | 7 | 100% same sign | close overall | same suction band, close overall (2.1% lower) |